Moving averages SMA, WMA and EMA
Calculator for calculating the moving averages SMA, WMA and EMA
The moving average (also moving mean) is a method for smoothing time or data series. The smoothing is done by removing higher frequency components. The set of moving averages is calculated iteratively ("sliding") over a section, the "window", of a given signal. The used window is shifted overlapping, i.e., repeatedly the last value is deleted from the considered section, the first value after the section is added and a new average value is calculated.
The calculator can be used to calculate the moving averages on any data series. The data series can be entered into a table or read in from a file. The period length can be chosen arbitrarily and thus the smoothing factor can be varied. Different smoothing values can be compared as well as different mean values. The SD standard deviation can be displayed for each mean value. Optionally, the data can be displayed as points or spline curves. The calculated mean values are listed numerically in a table in addition to the graphical display. The results table can be exported as a csv file.
The input is possible by loading the data from a file. The time series values must be separated by comma, space or semicolon. At the end there must be a semicolon as termination.
The result table is recalculated by calling 'Refresh'.
Number
Data
SMA1
SMA2
WMA1
WMA2
EMA1
EMA2
EMA3
Moving Average MA (or Simple Moving Average SMA)
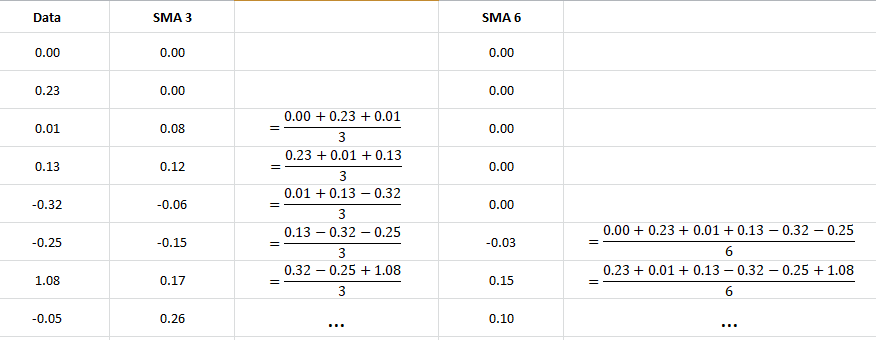
Calculation scheme for the SMA with period lengths 3 and 6
Calculation formula for the moving average:
SMAt= 1/n ⋅ ∑ti=t-n Ci
Ci: i-th value of the data series
n: Period length
With the arithmetic or simple moving average (SMA), all data points of a period under consideration are simply added together and then divided by the number of data points. Thus, every single data point has the same influence on the result. The average line calculated in this way smoothes the price trend. The average line is moving because with each new price added to the time series, the oldest price in the calculation is dropped.
Linear Weighted Moving Average (WMA or LWMA)
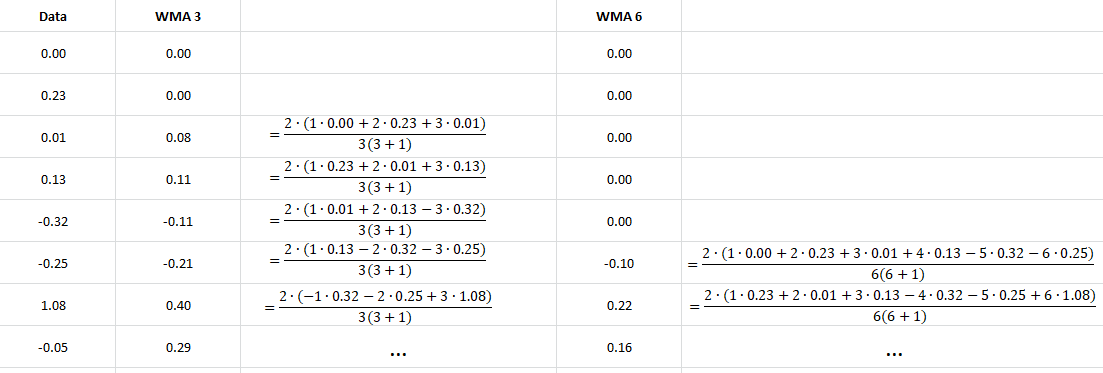
Calculation scheme for the WMA with period lengths 3 and 6
Calculation formula for the linear weighted moving average:
WMAt= 2/(n(n+1)) ⋅ ∑ni=1 i ⋅ Ct-n+i
Ci: i-th value of the data series
n: Period length
In linear weighted moving average (WMA), the closer data points are multiplied by a higher weighting factor than the more distant data points, with the weighting factor decreasing linearly until the oldest data point.
Exponential moving average (EMA)
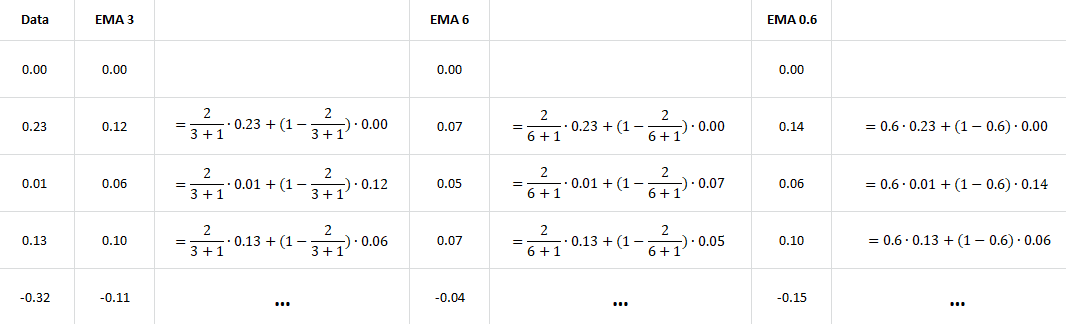
Calculation scheme for the EMA with the period lengths 3 and 6 and the smoothing factor 0.6
Calculation formula for the exponential moving average:
EMAt= Ct * SF + (1 - SF) * EMAt-1
with
EMAt: exponential moving average of the period under consideration
EMAt-1: exponential moving average of the previous period
Ct: Final value of the period under consideration
SF = 2/ (n + 1) Smoothing factor from the period length
where n is the period length
or SF= α with 0 < α < 1
With the exponential moving average (EMA), the entire existing data point data series always flows into the calculation. The set period length is only used to determine the weighting factor. With the EMA, too, the more recent price is given a higher weighting than the older one.
Screenshot of the Image
Print or save the image via right mouse click.
Releated sites
Here is a list of of further useful sites:
Index Calculator for Fourier series expansion Curve fitting for: linear line, power function, polynomial, normal distribution Newton Interpolation Horners Method Trigonometric calculations Taylor series calculator Normal Distribution Plot NxN Gauss method Derivation rules ODE first order